The Suppliers report, built in Power BI, provides insight into the collaboration between your organisation and its suppliers. It is a useful tool for purchasers and controllers, among others, who are looking for insight and control over their processes and collaboration with suppliers. Use the report for periodic supplier assessments or as a basis for making (better) agreements with suppliers. Do you suspect that there is (excessive) supplier dependency? This is also quickly apparent in the Suppliers report. The Suppliers report is part of the standard Blue10 Power BI report. Data from your own Blue10 environment is made accessible after it has been retrieved via a fast and secure connection to the OData API.
What insights does the Suppliers report offer?
The report consists of three pages: the Supplier overview, Supplier insights and Supplier comparison. In this blog, we will take a closer look at the different pages and how they are structured. More information about all Standard Blue10 Power BI reports can be found here.

1.Supplier overview
At the top of the report, you can filter by a period or administration(s) of your choice. This is useful if you want to zoom in on a specific situation or see whether any improvements in the process are having an effect in the short or longer term.

Number of invoices
How many invoices were sent by the selected suppliers during the selected period? Are these credit or debit invoices?
Top 20 invoices (count)
This overview shows the 20 suppliers from whom you received the most invoices during the selected period and/or administration(s), along with the percentage of the total invoices received during that period. If this is a very high percentage, it may indicate a high degree of supplier dependency.
Top 20 invoice amounts (value)
This overview shows the 20 suppliers with the highest total invoice amount for the selected period and/or administration(s), along with the percentage relative to the total expenditure in that period. This allows you to quickly see which supplier you pay the most.
Please note: Only debit invoices are currently displayed and totaled here. To view the credit invoices linked (in Blue10), hover your cursor over the supplier.
Top 20 credit invoices (count)
This overview displays all debit invoices for the selected period and/or account(s) and adds them up. This allows you to see which invoice amount is the highest, along with its percentage of the total expense for that period. Any linked credit invoices are not included here. To view the credit invoices linked (in Blue10), hover your cursor over the supplier.
Payment status
Here you can see how many invoices have been paid on time and how many have not. We look at the payment date of the invoice, which we retrieve from the accounting system. If the payment date is missing, we assume that the invoice has not yet been paid. We then check the due date and the current date in combination with the selected condition in the validation screen in Blue10.
If invoices are regularly paid late and you want more insight into the approval process to see where optimisations can be made, check out the “Processing” page of the standard Blue10 Power Bi report “Processing & auditing”.
Average number of days to approve and pay
The average number of days to approve and pay an invoice. Depending on your workflow in Blue10, this is calculated as follows:
- Post-Approve-Pay: the number of days between posting and approving for payment.
- Approve-Post-Pay: the number of days between validation and approval for payment.
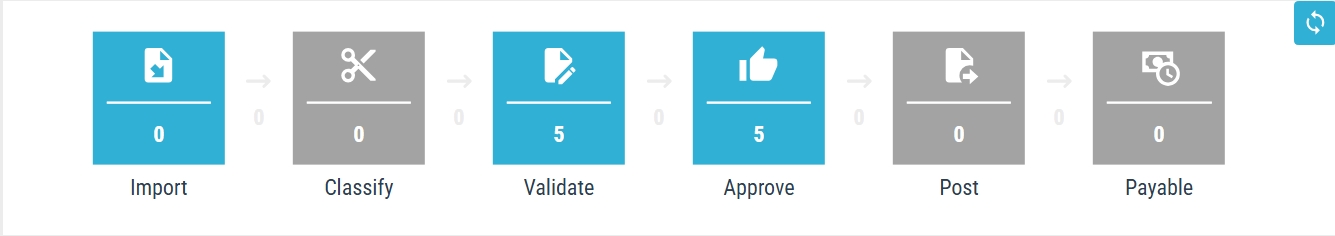
Tip: if you do not know which workflow you have, open Blue10 and view the dashboard. The order of the last three tiles determines the type of workflow, see the images.

A dashboard in Blue10 with a Post-Approve-Pay workflow
A dashboard in Blue10 with an Approve-Post-Pay workflow
Top 20 invoices paid too late (count)
This overview shows the 20 suppliers with the highest number of late invoices for the selected period and/or administration(s). You can see the average number of days these invoices were paid too late, how many invoices are involved, and how many invoices in total from this supplier were found in the selected period and/or administration. This allows you to quickly see which suppliers’ payment behaviour may have a negative impact on your relationship with them.

The image above is a representation of the Supplier overview
2. Supplier insights
In addition to the overview page, where a number of fixed filters are set, this details page offers the option of flexible filtering based on a period of your choice. You can also zoom in at supplier level to gain more insight into your relationship with a specific supplier, for example in preparation for a discussion about price agreements. Move your cursor over the graph to see more information, such as the total invoice amount.
You will also find the following information, as described on the overview page:
Number of invoices
Payment status
Amount
Average number of days to approve and pay
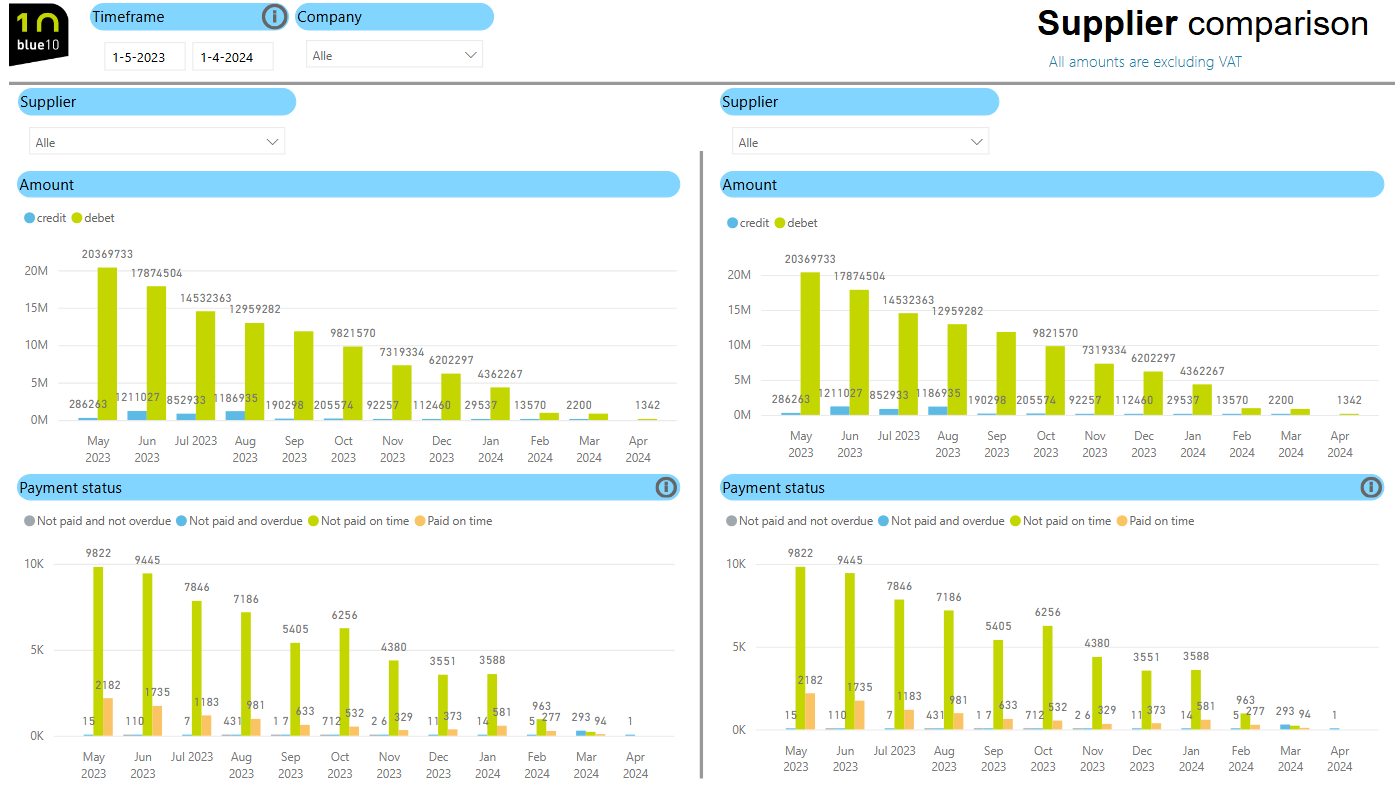
3. Supplier comparison
Compare one or more suppliers with each other over a period of your choice. This allows you to see, for example, whether comparable suppliers differ greatly in terms of monthly invoiced amounts and payment status. This provides insight into differences between suppliers, enabling you to take appropriate action.
How can you access the Suppliers report?
The standard Blue10 Power BI reports are available as part of the Blue10 Enterprise subscription. If your organisation already has this subscription, please contact Support. Would you like more information about the Blue10 Enterprise subscription? Read more here.
Other reports
In addition to the Suppliers Report, the standard Blue10 Power BI reports also include the Purchase Order Report and the Processing & Auditing Report.